User Guide
The pgEdge AI DBA Workbench provides a browser-based interface for monitoring and managing PostgreSQL database estates. This guide covers the features available to users of the web client.
What This Guide Covers
The User Guide is organized into the following sections:
- Dashboards describes the monitoring dashboard hierarchy and the metrics each level displays.
- Alerts explains how to view, acknowledge, and manage alerts in the web interface.
- AI Features covers AI-powered summaries, analysis, and the Ask Ellie assistant.
- MCP Tools lists the Model Context Protocol tools and resources available to compatible AI clients.
- Blackouts describes how maintenance windows suppress alerts for servers, clusters, and groups.
Getting Started
The web client connects to an MCP server instance. After installing and configuring your Workbench installation, open a browser and navigate to the server address to authenticate with the Workbench.
Log in with the user credentials added during configuration to begin monitoring your PostgreSQL estate.
Note
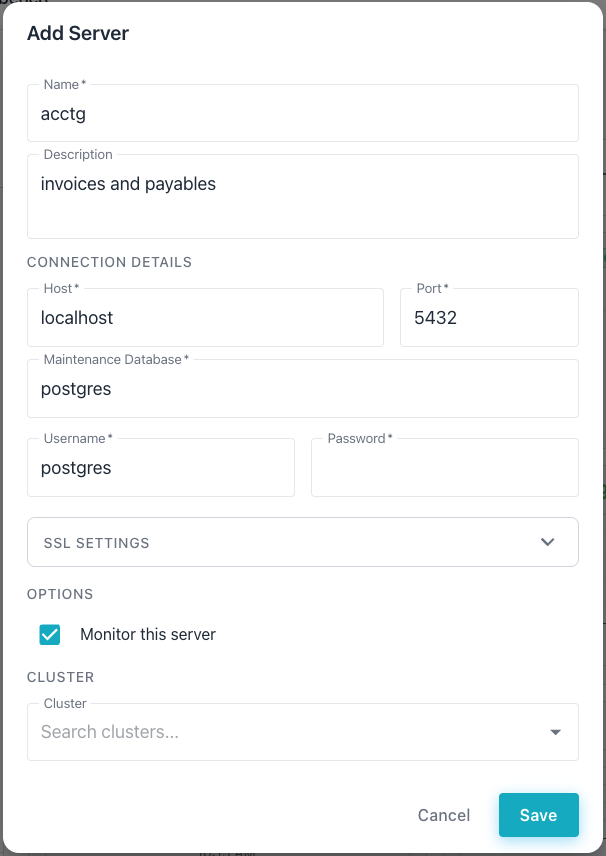
After logging in, select the + next to the DATABASE SERVERS heading
in the left navigation panel. The Workbench adds a new server definition
entry.
For detailed information about using the Workbench, see the User Guide.
The cluster navigator on the left side of the interface provides tree-based navigation across groups, clusters, and individual servers. Select a node in the navigator to view dashboards, alerts, and AI insights for that scope.